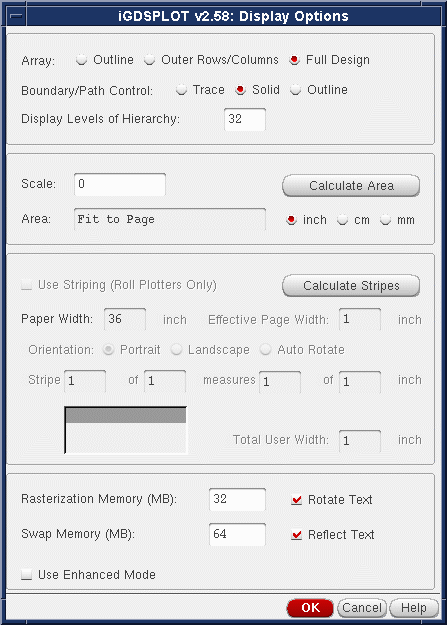
Clicking on the Display Options button from the main iGDPSLOT dialog opens the dialog box shown below:

|
Clicking on the Display Options button from the main iGDPSLOT dialog opens the dialog box shown below: 
|
|
Outline - Only a outline of the entire array is plotted. |
Outer Rows/Columns - Outer rows and colums are plotted. |
Full Design - All elements of an array are plotted. |
|
Trace - Only the centerline of the path is plotted |
Solid - Paths are plotted as solid. |
Outline - Paths are plotted as if they were boundaries (default) |
|
0 - Everything is plotted from the current level all the way to the lowest level. [Default] |
n - Only n levels are plotted. For example if n=2 then only entities in the cell under consideration and entities in the cells directly referenced by this cell are plotted. |
|
0 - Data extents are scaled to fit to the plottable area on the page. (Page size less the margins...) |
XXX - Data extents are scaled per user defined value. Note that no attempt is made to insure that the image will fit on the plottable area of the page. |
|
XX - The number of MB allocated to holding the raster image of the page. Typically this value will range from 20-64 MB depending on the available RAM on the workstation. 64 MB can hold about a 36x36 image. If the image is larger than this then the program subdivides the image into smaller pieces and assembles the raster data on disk. |