A Simple CSV Reader Plug-in for Qckvu3
This application is intended primarily as a teaching/training aid for those who wish to learn how to write plug ins for Qckvu3. The full source code is available from the programmer's corner.
How it Works
The user opens a GDSII or OASIS file. The user then starts the CSV Reader and selects a CSV file. The CSV file contains a cell name, a list of layers to turn on and an X,Y coordinate. The display is controlled by the contents of each CSV line.
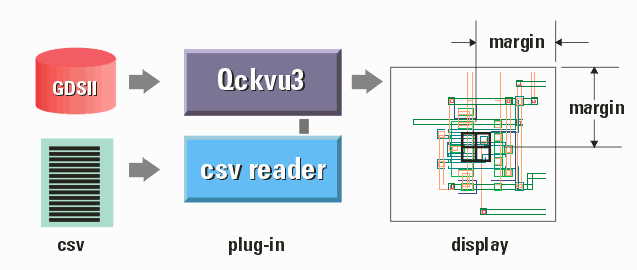
The format of the CSV file is shown below:
STRUCTURE,LAYER,X,Y

where

 STRUCTURE - the name of the structure (cell) to display. This is case
             sensitive.

 LAYER     - the layer or layers to display. The keyword ALL indicates
             all layers should be displayed. If more than one layer is
             to be displayed, separate the list with semicolons.
             i.e.   TOP,5;6,50,50  will display layers 5 and 6.

 X,Y       - center coordinates. These are in user units.
The CSV file can have as many entries as the user wants. These are displayed in the CSV Reader's scrolling window. Clicking on any line triggers two actions:
- the center of the display is moved to the coordinate and the display zooms in (based on a user defined margin)
- A marker is placed on the coordinate (the user defines the shape, color, thickness and size of the marker.
Uses
While this plug was developed as a learning tool, one might use it as a way to review critical problems in a layout. One could easily extend it by having a string of text associated with each site that would be displayed or by snapping a bitmap of each window.
User Interface
The CSV user interface is described below:
Starting the CSV Plug-In (UNIX)
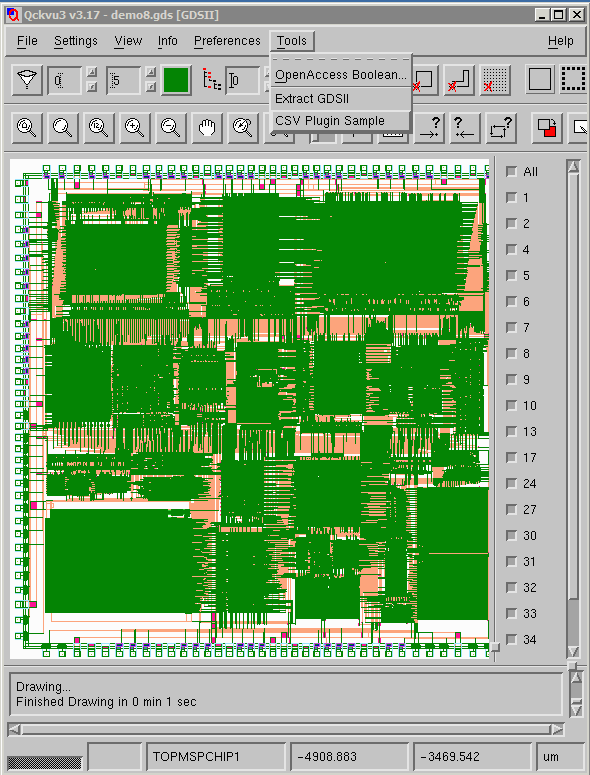
Load a GDSII or OASIS file into Qckvu3. Then from the Tools drop down menu select: CSV Plug In Sample.
The CSV Plug-in Dialog
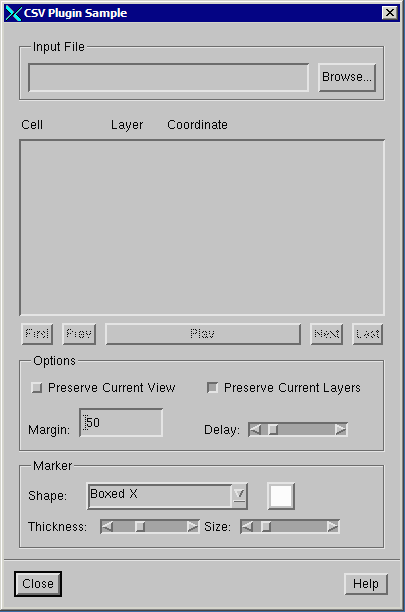
The dialog is shown below:
|
Input File - a comma delimited ascii file (CSV). The following are from the CSV file: Cell - the name of the cell to display Layer - the layer or layers to display Coordinate - the "center" coordinate Clicking on any line updates the display to reflect the cell, layers and center coordinate. Playing Controls You can have the display jump from line to line by using the Play button. The delay between screens is controlled by the Delay slider. Options Preserve View - if this is checked then there is no zoom in/out based on the margin setting. This is normally used if you want a birds eye view of the various locations in the list. Preserve Current Layers - if this is selected, then layers are not changed per each CSV line entry. Margin - the distance from the center to the edges of the display for each coordinate provided. Marker Shape - choose from a list of markers shapes. Color - click on the colored box and select the marker's color. Thickness - adjust the slider to make the marker strokes thicker or thinner (pixels) Size - adjust the slider to control the marker's size (pixels) At right, you can see what the dialog looks like once a CSV file has been loaded. |
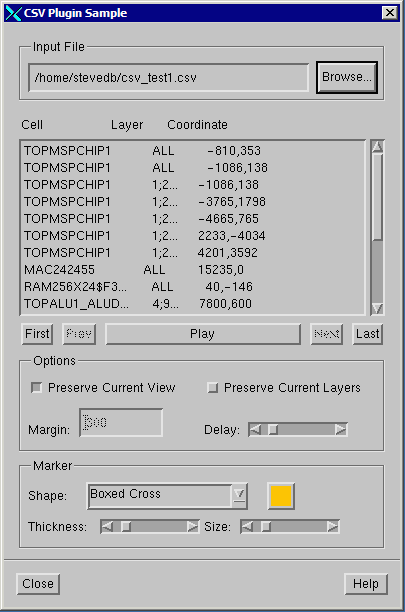
|
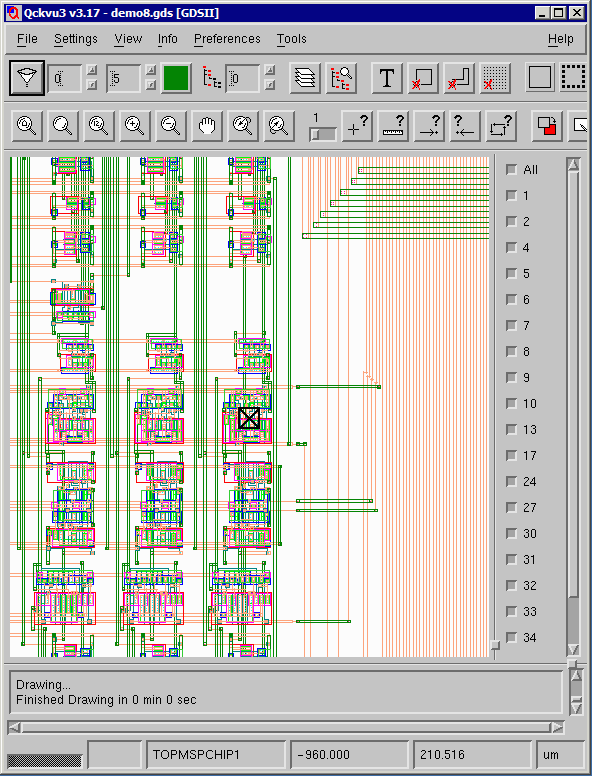
Below you can see an example where the display has been zoomed in and a marker shows the coordinate read from the CSV file.
Contact
For more information please contact: Steve DiBartolomeo, Applications Manager, Artwork Conversion Software, Inc. steve@artwork.com, 831 426.6163.
