web page logo for Extracting Geometry and Thermal Heat Sources for FEA Modeling of Chips


Extracting Geometry and Thermal Heat Sources for FEA Modeling of Chips

The introduction of TSV's (through silicon vias) may require chip designers and packaging engineers to examine in more detail the stresses that thermal expansion of the chip puts on the TSV's connections.


In order to model such stresses one needs to know:

  • the locations of heat sources on the chip

  • the amount of heat each source generates

  • boundary conditions

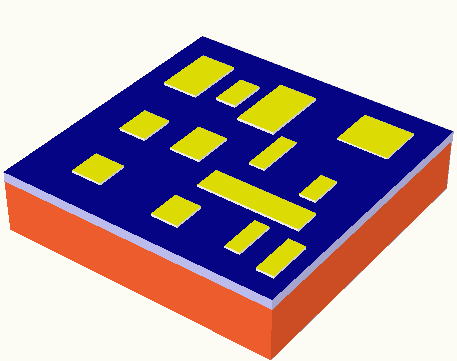
  3D View of a chip with major heat sources


Once this data is acquired, it can be input into a thermal simulation tool that then produces a temperature map or profile throughout the chip.

Temp Profile to Expansion to Stress

Once you know the temperature profile of the silicon chip, you can then take this information into a mechanical FEA tool, that together with the chip's material properties, can be used to compute the expansion, and if the chip is fixed (say to a heatsink or another chip) the local forces generated by the expansion.

Effect on TSV

Since the TSV runs through the length of the chip and is attached to a second body on at least one end, it too will be subject to forces due to thermal expansion. Knowing where each TSV is located and its crossection one can then predict the forces on the TSV that might cause it to detach from the adjoining chip or substrate.

Collecting the Necessary Data

We are going to assume that you do not have access to some high level design tool, such as Cadence Encounter, that already can produce all the data you need. Instead we are going to asssume that you are "throwing over the wall" data from the IC designers to the thermal/mechanical designer.

In this case the IC designer needs to collect the following:

  • GDSII Layout of the Chip - the thermal designer will use this to define the chip's extents, the location of heat generating cells and the location of the TSV's.

  • a table of cell blocks vs their heat dissipation. The trick here, first is to get some reasonable numbers and to collect the data at the right level of granularity -- you don't want to use such a tiny functional cell such as a gate where you will get 100,000 heat sources. Most important, the names in this table must match the GDSII structure/cell names since we will use this list to extract all of the placements of the cells in the GDSII file.


Using Qckvu3 with the Heat Source Plug-In

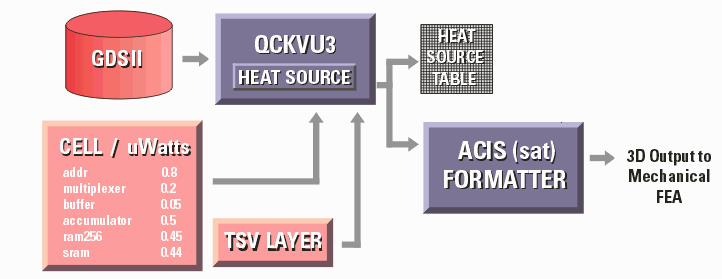
Artwork's Qckvu3 with the Heat Source plug-in is ideal for extracting the rectangle heat source coordinates. The flow chart below shows how we will use the program to collect and format the thermal data.

Qckvu3/Heat Source flow for extracting heat sources from GDSII

Opening the GDSII File

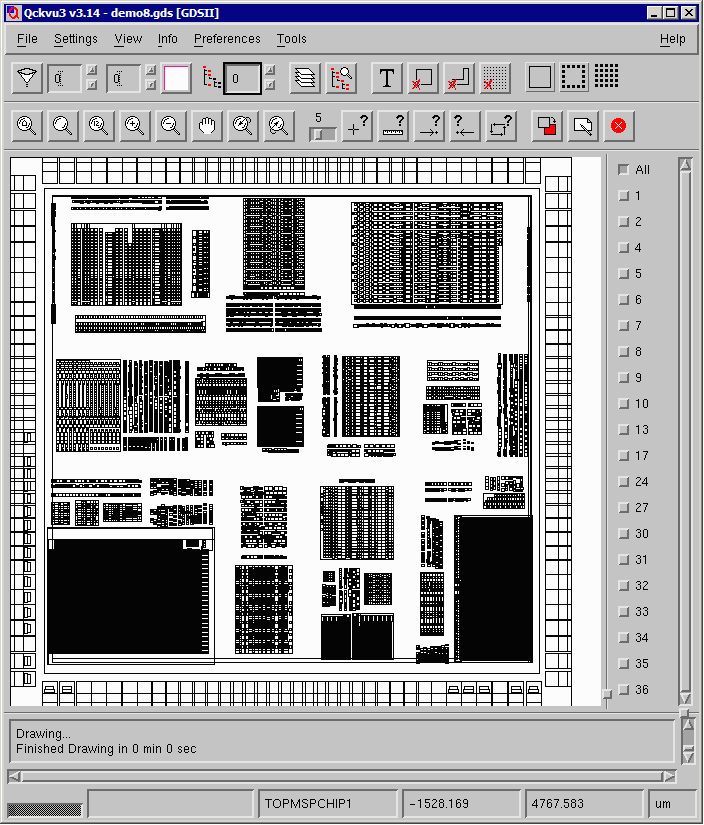
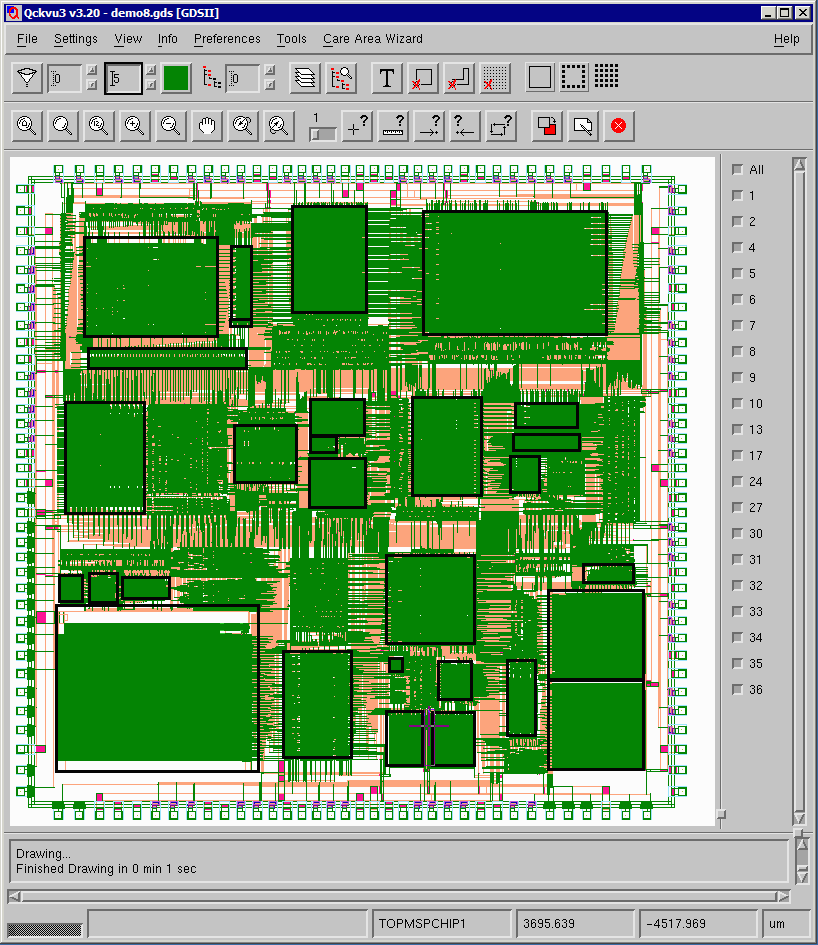
First the GDSII file under analysis is opened and the display mode is set to show just the cell placement outlines. We don't want the detailed metal, diffusion, poly and implant layers.

View of a Chip in Cell Outline Display Mode

View of a Chip in Cell Outline Display Mode


We now use the Heat Source Plug In to open an ASCII file (already prepared) that contains a list of cells and the power dissipation associated with each cell. The list looks something like this:

TOPHSAB_HSABPD,120
TOPHSAB_HSABPA,140
RAM64X16$F36,20
TOPALU1_ALUDP1,230
TOPMAC1_MACDP3,120
TOPMAC1_MACDP2,105
TOPMAC1_MACDP1,110
MAC242455,209
G79S8F35,40
G79S2F35,55
G79S4F35,40
TOPXYOPMUX_XYMUXDP1,340
TOPXYREGBANKS_XYDP1,40
TOPSTATCONFIG_STATDP1,400
TOPCONDINTLED_DPCND1,110
TOPUCODETIMING_CODEDP4,35
TOPUCODETIMING_CODEDP3,35
TOPUCODETIMING_CODEDP2,35
TOPUCODETIMING_CODEDP1,35
TOPINDEXNOISE_INDEXDP1,105
TOPHOSTIINTFC_HOSTDP1,100
TOPDRAMINTFC_DRAMDP5,20
TOPDRAMINTFC_DRAMDP4,20
TOPDRAMINTFC_DRAMDP3,20
TOPDRAMADDR_DRADDP1,45
RAM256X24$F36, 220
G79S0F35, 205
G62S1F35, 180

The first column in the file is a cell name and the second column is a power dissipation.

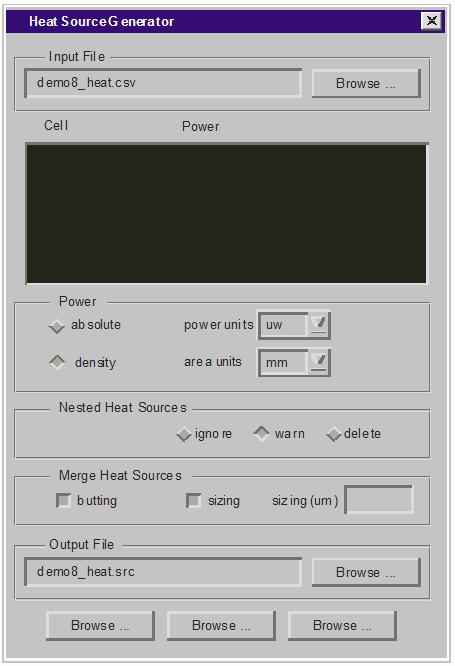
  heat source plug-in dialog
heat sources highlighted on display
 

Dialog Box Fields and Functions

Input File - select the ascii list containing the list of cells and power dissipation associated with each cell. The file can be comma, space or tab delimited.

Power - Power can be expressed as an absolute value for that cell (i.e. 250 mw) or as a power density i.e. 5000w/square meter. The power units must be selected (uw, mw, w) as well as the area units (um, mm, cm, m) if density is selected.

Nested Heat Sources - if a cell in this list is referenced by a higher level cell also in the list we are faced with a quandry: are we duplicating a power source uneccesarily? The user has three options: Ignore - the program will not bother to check for nested power sources; Warn - the program will check for such conditions and warn the user but will generate all of the heat sources; Delete - the program will delete any heat source which is referenced by a higher level heat source. If the Delete option is checked, warnings will also be generated.

Merge Heat Sources - if a user specifies a cell/power and this cell is placed thousands of times in the layout then the heat source file may grow very large and this may negatively impact IcePak's ability to generate results. There is the possiblity to merge a large number of heat sources into a smaller number.

If butting is checked, then any heat source rectangles that touch or overlap are combined. If sizing is checked, then all heat sources are first sized up by the specified amount and then merged. The total amount of heat generated is preserved; however the source rectangles may include areas that did not "produce" any heat prior to the merging.

Output File - the user selects the directory and base file name for the output. Three files are produced: an ascii heat source file suitable for import into IcePak, an GDSII file showing the outlines of the heat sources, a log file summarizing the conversion which will contain the input data (list of heat sources) along with any warnings and conversion statistics.


Heat Source Output File

Now that we have all of the geometry, the final step is to take our cell placement outlines, convert them to ASCII and build a table that can be read into ICEPAK. Arwork can easily customize the output formatter to whatever syntax is needed. Here is the format of what the ICEPAK software needs to see:


cell name        LLx    LLy    LLz    URx    URy    URz    Plane

Grid_0_0          0     0      350   1000    1000    350      2

Grid_0_1          1000  0      350   2000    1000    350      2

#Sources Rectangular Object                              
       

name       power_total    power_total_units 
         

Grid_0_0    0.00240514         W               
Grid_0_1    0.00281215         W 

Once IcePak has this heat source file, the simulation engineer adds in a couple of simple geometries and their thermal properites and of course, the boundary conditions - for example he may "attach" the bottom of the chip to a copper heatsink, and the other surfaces interface to air.

The output of IcePak is a 3D distribution of temperature.

This distribution along with the material properties of the chip can then be used as input to Ansys where one compute a 3D map of stresses and strains.

Contact

For more information please contact: Steve DiBartolomeo, Applications Manager, Artwork Conversion Software, Inc. steve@artwork.com, 831 426.6163.