Plug-In Example: A CSV Display Navigator |
|||
A common requirement for a layout viewer is the ability to read a list of coordinates and to move the display from point to point allowing a user to quickly inspect the region around the coordinate. This could be a list of defects or hot spots. As a further refinement the list might include both a layer or layers to be displayed and could also include a cell name. We've developed such a plug-in for Qckvu3 and provide both the application and the source code for plug-in developers. |
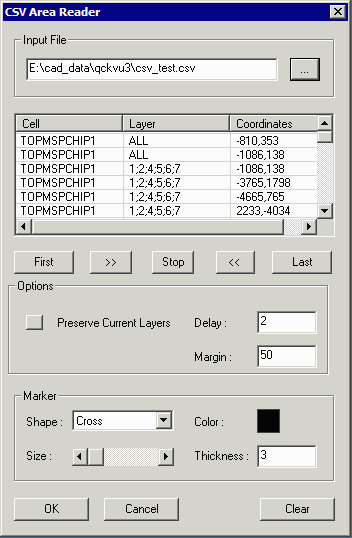
How It WorksThe user opens a GDSII or OASIS file The user has prepared a comma delimted file with the cell name, layers to turn on and coordinates as the columns. The user starts the plug-in and loads the CSV file. the user clicks on any entry and the display is zoomed in around the specified location. Whatever layers are specified are turned on. A marker is placed at the specified coordinate. the user can control the marker shape, size and color. The user can control the size of the zoom in window If Preserve Current Layers is checked, the layers that are turned on are not changed from view to view. |
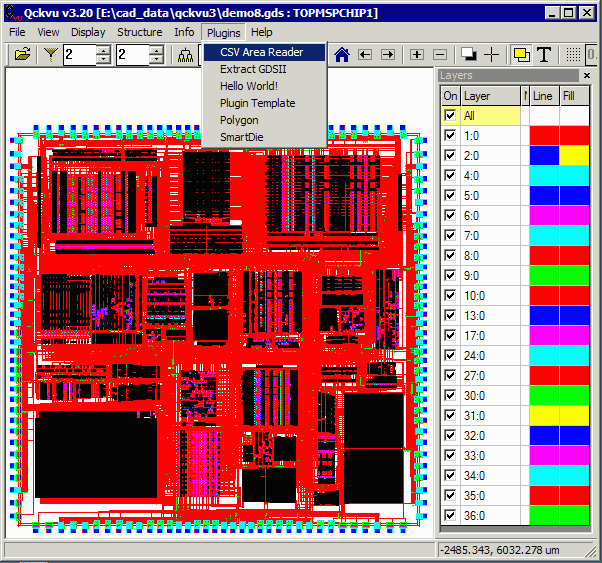
Download the Binary (.dll)csv.dll 36KB last revised 7/18/09 If you want to install the csv.dll plug-in create a directory under the /wcad/qckvu3/plugin directory called csv and place the csv.dll there. When you start up Qckvu3 you will see the "CSV Area Reader" in the Tool pull down menu. Download the Source Codecsv_source.zip 2.26 MB - contains .cpp, .h and other files for Microsoft Visual 6 compiler |