A Batch File for Plotting Stream Files to TIFF
by Steve DiBartolomeo and Hagai Pettel
December 23, 2003
IV. The Plotter Configuration File: PLOT.CFG
The plotter configuration file controls the plot parameters such as plot output type, pageor bitmap size, DPI, rotation and margins. Before attempting to create the plot.cfg file one should first calculate the required image size and raster memory.
Calculating the Correct Page Size and Raster Memory
When plotting from a script you generally will need to know several things about the data you are plotting. For example, rather than rely on GDSPLOT to automatically calculate the extents of the data to be plotted one should measure this and define the plot window. The plot window is part of the main configuration file.
Once you know the data extents you have three variables: DPI (dots per inch), scale factor and bitmap size. Picking any two of these determines the third value. The formula below gives the relationship.
Data Extents x Scale x DPI = pixels
Example
Imagine your chip has an extents of 2941 x 2626 um and you want to create a 100X image at 300 dpi. Then only the size of the bitmap is left to calculate:
2941 um       100      1 inch            300  dots
-------   x   ---    ----------    x    ----------  =  3474 pixels (along X)
                      25400 um               inch


2626 um       100      1 inch            300  dots
-------   x   ---    ----------    x    ----------  =  3102 pixels (along Y)
                      25400 um               inch
Memory Calculation
The raster memory required to assemble this bitmap can be calculated as follows knowing that each pixel requires 8 bits since we are outputting a 256 color paletted image:
RAM (MB) = pixels along X  x pixels along Y  x 8 bits/pixel
           ------------------------------------------------
                  8 bits/byte x 1,048,576 byte/MB
in our example then, the required raster buffer RAM is: 10776348 Bytes or 10.28 MB
Here is a sample plot.cfg file and an explanation of the lines that need to be customized. Notes in italics are not part of the file.
pltcfg.ROTATE: 0                              plot rotation = 0
pltcfg.TOP:    0                              top margin = 0
pltcfg.BOTTOM: 0                              bottom margin = 0
pltcfg.LEFT:   0                              left margin = 0
pltcfg.RIGHT:  0                              right margin = 0
pltcfg.PGSIZE:  Y 3474,3102                   image size for bitmaps in pixels
pltcfg.RstrBuffSize: 10776348                 memory reserved for raster buffer (in bytes)
pltcfg.PLTYPE: rtu2 256:rtifplot -erstrzcol   plot output format
pltcfg.Transparency: on2                      always leave transparency = on2
pltcfg.GDSRAM: 10                             ram allocated to loading GDSII data (MB)
pltcfg.InvImage: off                          invert image polarity = off
GDS.AREF: 2                                   AREF=2 means plot full array
GDS.FILL: 0                                   treat paths as boundaries
Raster.PatternFile: /drv9/colfill.pat         location and name of fill pattern file
pltcfg.ORIGIN: 0.000000,0.000000              page origin (leave at 0,0)
rtu2.DPI: 300                                 DPI setting for the TIF output
UNIX vs. Windows
The Unix and Linux versions of GDSPLOT read an ascii file called plot.cfg which means the user who wishes to run these in mode must create such a file as shown above. However the Windows version no longer reads the plot.cfg parameters from a file -- instead it reads the values from the Windows registry.
This means that if you are running on Windows, you cannot just create a plot.cfg file but rather must update the registry. Since you don't want to write a program just to update the registry it is better to use the GDSPLOT GUI to set your parameters and let it update the registry. Once you have got the correct values in the registry you can forget about updating them.
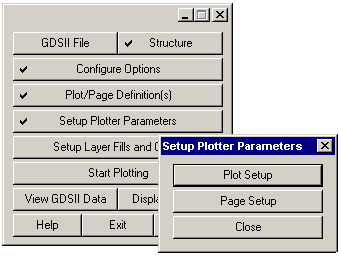
To set the values in the registry, first start GDSPLOT, load a file and then open the plot configuration by seleting the Setup Plotter Parameters from the main menu. A new window will open with buttons for two sub windows:

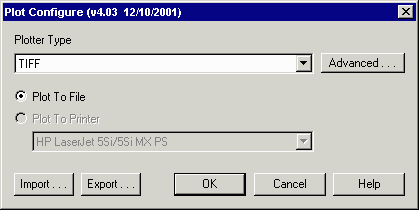
Plot Setup
In the plot setup dialog, set the Plotter Type to TIFF and make sure Plot to File is selected.

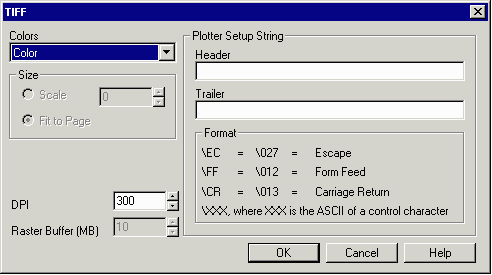
In the Advanced dialog for TIFF, make sure the option is set to Color (if you want Color) and the DPI to 300 (assuming you want 300 DPI)

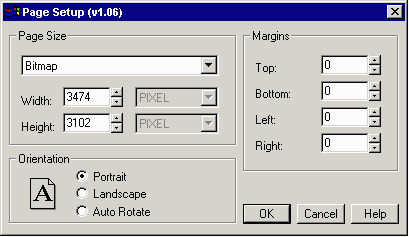
Page Setup
Now go to the Page Setup Dialog and set the Page Size to Bitamp with the appropriate width and height in pixels. Set the orientation to portrait (no rotation) and make sure all margins are set = 0.

Upon hitting the Close buttom the new values are written to the registry. From this time on, unless you run the plot and page setup again, the values stored in the Windows registry will remain there.