Example 2
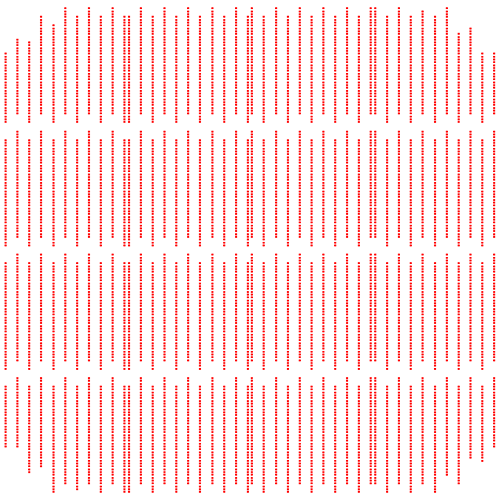
The drill file, example2.drl, needs to be converted to laser format. Here is what the file looks like. (drill diameters have been increased for visibility. The extents are approximately 155 x 155 mm.

Determining the Drill File Parameters
Upon opening the file in a text editor we can examine the first few lines:M48 <- marks the beginning of the header METRIC,TZ <-- metric (mm) with Trailing Zero Inclusion FMAT,2 <-- use format 2 commands % <-- rewind stop M71 <-- metric measuring mode G05 <-- drill mode T01C.1500 <-- tool select and diameter X-680Y-43200 <-- drill coordinate X-680Y-44100 X-680Y-45000 X-680Y-45900
This header is very complete - we know that the data is in units of mm and that trailing zeros are included. By default, coordinates are absolute instead of incremental. (If they were incremental the directive -- ICI,ON -- should be present in the header. The only thing we don't know is the format.
The Excellon spec allows 3 different digit/resolution combinations for metric:
| Number of Digits | Resolution | Format Statement |
| Five | .00 | 3.2 |
| Six | .00 | 4.2 |
| Six | .000 | 3.3 |
Unfortunately, you won't find the format statement in the header. So you have to make an educated guess; using the extents is usually helpful assuming you know them. For example, scanning through the file you will find a coordinates such as:
X38320Y-24900

and

X-38320Y2400
If the resolution is .00 then the X range is from 383 mm to -383 mm which is over 760 mm! The substrate is unlikely to be this large. Therefore the resolution must be .000 and the correct choice of format = 3.3.
Therefore our command line should be:
c:\wcad\drl2lsr\drl2lsr.exe           <-- the conversion engine

   example2.drl                       <-- the drill file to convert

    -drlunits:mm                      <-- units of the drill file

     -drlformat:3.3                   <-- data format of drill coords

     -drlzeroinc:trailing             <-- zero inclusion parameter

      -drlxymode:absolute             <-- coordinate mode parameter

       -laser                         <-- output laser file

        -type:UV                      <-- type of laser = UV

         -out:example2                <-- output file base name

          -log:examle2.log            <-- log file
Results
The conversion is completed in a second. Two files are produced: example2.lsr (the laser file output) and example2.log, the log file.
The example2.lsr output looks like:
M48
METRIC, LZ
;SOURCE FILE: example2.drl
;DATE: Wed Sep 09 14:12:41 2015
;SCAN SIZE: X=50.000, Y=50.000
T1C0.150
M95
T1
BLOCK0_0   X-52.320Y-51.500
U-9.944V-24.100
U-9.944V-25.000
U-9.944V-22.300
U-9.944V-23.200
The log file includes useful information:
Drill2Laser Drill Converter v1.1 rcs 1.105 (2015/08/28)
(C) 2015 Artwork Conversion Software, Inc.  (831) 426-6163
info@artwork.com, www.artwork.com

=============================
Converting Drill File
=============================

Input Drill File Info:
-File: example2.drl
-Units: MM
-Format: 3.3


Output Info:
-Units: MM

ROI Window: -77.320, -76.500, 77.320, 76.500
Tile Width: 50.000
Tile Height:50.000
Margin Width: 0.000
Margin Height:0.000

Calculating Block Extents ...

Total Blocks: 16 (4 x 4)
Block Extents:
Block [0_0]: -77320, -76500, -27320, -26500
Block [1_0]: -27320, -76500, 22680, -26500
Block [2_0]: 22680, -76500, 72680, -26500
Block [3_0]: 72680, -76500, 122680, -26500
Block [0_1]: -77320, -26500, -27320, 23500
Block [1_1]: -27320, -26500, 22680, 23500
.
.
.
Number of Drill Holes by Tool Number:
Drill 1: 6524

Total Scanned Drill Counts: 6524
Using -gbr to Verify the Output
Of course, the laser file can only be processed by the specific machine the output is intended for. If you want to visualize the output we have a way to do that. Instead of using -laser on the command line use the -gbr on the command line.
drl2lsr.exe example2.drl -drlunits:mm -drlformat:3.3 -drlzeroinc:trailing ... -gbr -out:e2_simulation
The output will be a Gerber file that you can view in Artwork's GBRVU (or other Gerber viewer). However the data is specially organized to help the user see both the windowing and the actual serpentine pattern within the windows.
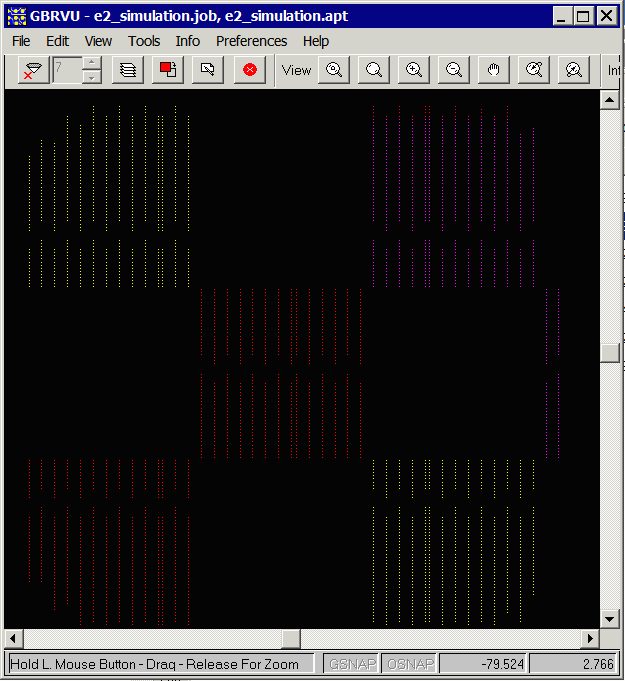
When you first open the e2_simulation.gbr file you will see something like this:

That's because we place each "window" onto its own Gerber internal layer and we have to use LPD/LPC layer polarity to keep the layers separate. So you should go into the layer dialog and make all layers PAINT.
Open the layer dialog and change all of the layers to PAINT.
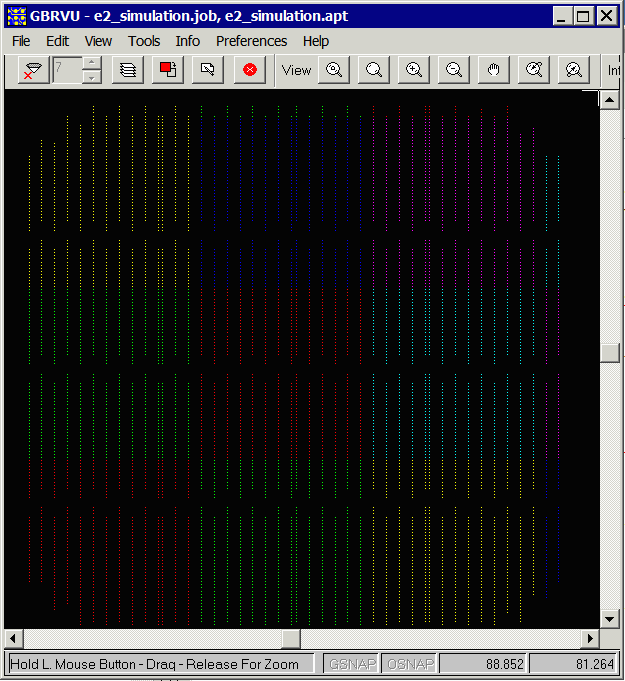
The display should now look like this:

By turning on/off individual layers you can see the individual windows. The layer order should correlate with the order of the windows.
