title.gif

Converting a Ball Map Back to a Table

Designers who modify or otherwise create a ball map would also like to be able to convert it back to a table. To do this we have written a VBA module for Excel.

1. Open an existing Excel spreadsheet and display the sheet containing the ball map. This ball map can be created either by the ball map program or by hand as long as the data in each cell represents the netname and as long as the correct JEDEC labels are in place along the left and top of the ball map. It doesn’t matter whether you view the part from the top or bottom side.
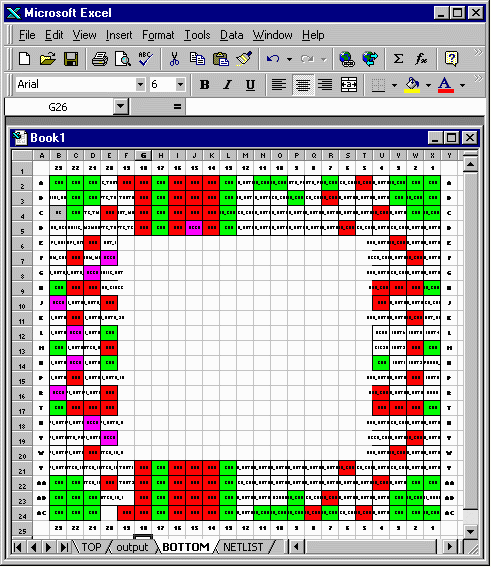
starting_ballmap_to_table.gif

ballmap_pd.gif


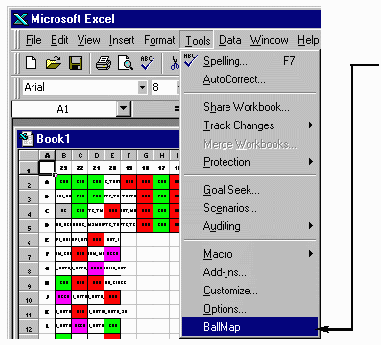
2. In Excel’s Tools pulldown you will see an option: Ballmap to Table. Click on it.

ballmap_to_table_dialog.gif

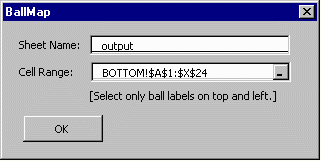
3. A small dialog will appear. Enter the name of the sheet you wish to create. If this name already exists then the data will be written into the existing sheet and may overwrite data already there.


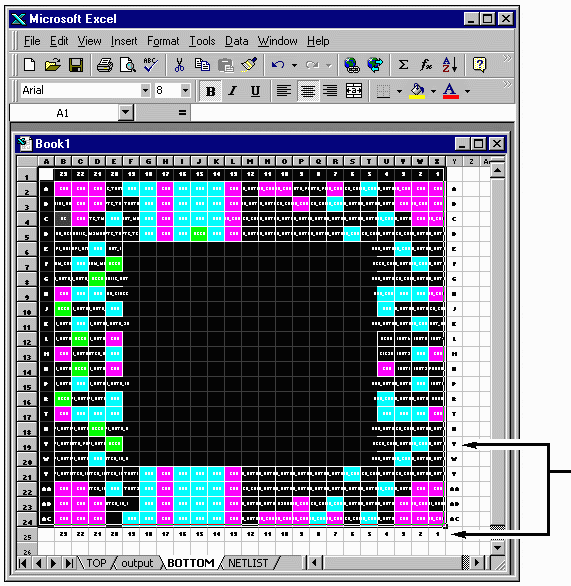
4. Enter the range of data to analyze. This must include the JEDEC labels on the left and top side but must not include labels on the right and bottom. You can type the range into the dialog box or use your cursor to select it like you would any other range of cells.

selected_ball_map_area.gif


Notice that we did not select the labels on the bottom and right.

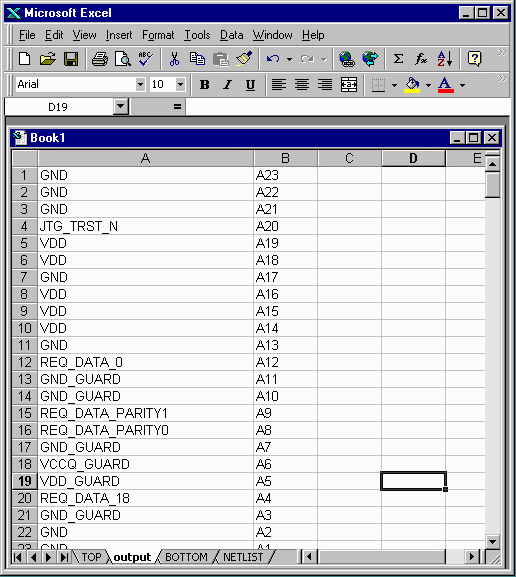
Hit OK and the Ballmap to Table module creates a table of net names vs. JEDEC balls in the worksheet you’ve specified. This data can be easily sorted, counted or exported as ASCII to other tools.

output_netlist.gif

Compatibility

We’ve tested ballmap with all version of Microsoft Excel Office.


(previous)

1

2

3

= 4 =