Benchmark
In order to test our most recent optimizations for BoolCompare we arranged to run a large area mask on a workstation equipped with 40 CPU cores (this is not including virtual cores due to hyperthreading.)
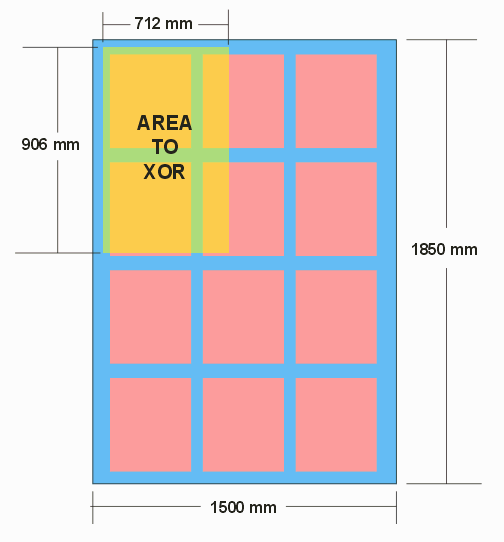
The layout looks something like this (proprietary):

We selected a window covering about 23% of the total layout to perform the XOR.
Scanning and Loading
The scanning and loading of the GDSII file into memory took only a second. The file is not large (a couple of hundred MB) but is very deeply nested.
Estimating Total Number of Vertices
Earlier versions of BoolCompare performed a full explosion in order to precisely count the number of vertices in the selection window. This is quite time consuming and the latest version of BoolCompare uses the data produced during the scanning/loading process to estimate the number of vertices.
Instead of 13 minutes which the previous version required, this version used only 1 second to come up with the estimate.
The estimated value came in at approximately 27 Billion vertices.
Computing the Tiles
Our testing tells us that the optimum number of vertices per tile (to stay away from the steep part of the computation curve) is 500,000 per tile. This would result in approximately 54,000 tiles -- however for some other reasons the actual number of tiles was set to 57,400.
Our array of tiles was 205 x 280.
Dealing with Density Variations
While the average vertex count for each tile is 500K, the density varies significantly so some tiles end up with many times more than 500K vertice and other tiles are quite empty. We don't want to submit a tile to the XOR engine that has considerably more than 500K tiles - when a XOR thread requests a tile it first counts the vertices -- if the count is too high, it subdivides the tile and returns it to the pool of tiles.For this layout window, the actual tile count rose from 57K to almost 460K tiles - an indication of extreme variations in tile density.
Total Time
The total time to load, estimate and then perform the XOR operation was 140 minutes. This compares favorably to alternative programs which took as many as 24 hours and is almost twice as fast as Artwork's previous version which used an older and less efficient "exploder."
Future Enhancements
Profiling indicates that the XOR operations spend a considerable percentage of their time waiting for data from the exploder. While the QisLib exploder is considerably faster than the earlier GDSMachine exploder, it is still a single threaded exploder. It should be possible with some work, to incorporate Artwork's multi-threaded exploder (QisMLib) into the flow. This should reduce the XOR engine waiting time almost to zero. (However some of the improvements are likely to be reduced because of CPU-memory bandwidth limitations)
